Show Interactions Chart
The User Interface application allows the user to view the interaction data of a single or group of columns together within a chart format. The Interactions grid must be grouped by one or two fields to chart the data. Grouping on two fields results in a 2-Axis chart. The user has the same options to customize the chart as in the Dashboard application.
Note that any customized Show Interactions Chart settings are included from the current Retrieval > Settings > Report Settings configurations. To save a specific Chart setting for a report, use any of the following commands to save the report definition after customizing the chart:
Retrieval > File > Save Current As Default Report Settings
Retrieval > Favorites > Save Current Report To Favorites
Retrieval > My Reports > Save Current Report To My Reports
In the Interactions grid, group one or a more columns together by moving the column headers to the grey area just below the Interactions title bar. A new window will appear with the data set sorted for those grouped columns.
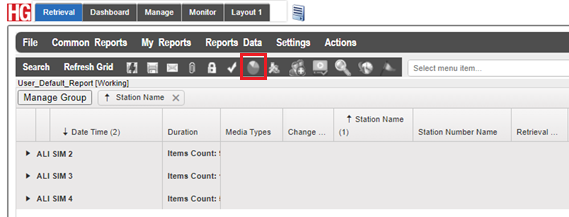
Dragging Column Header
After the columns have been moved and grouped together, the Show Interactions Chart button  will appear in the Grid Action Controls. Click this button to display the grouped columns as a chart in a separate Interactions Chart window.
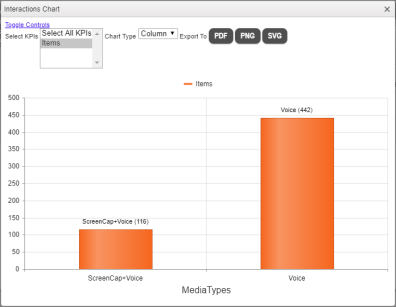
Interactions Chart
Clicking on the Toggle Controls options link in the Interactions Chart window will display the following customizable settings for the user:
Select KPIs - The user can select which KPI data is displayed in the Interactions Chart. These are the KPI options to choose from:
Select All KPIs – Selecting this will display all the KPI options in one chart
Items – Displays the total number of interactions that the user has reported on and grouped together.
Chart Type - The following chart types are available to display the interaction data:
Area, Bar, Pie, Column, or Line.
Export To - User will be able to export the chart data to either a .PDF file, a .PNG image file, or a .SVG file.